If a new visitor lands on your website, you may be wondering how they came across your business and the answer lies in your Google Analytics Acquisition report.
As the name implies, Acquisition data gathers information about how your audience came to your website during their visit. Some users might do a Google search and discover your business on the first page of results. Alternatively, some might engage with your business on Facebook and follow a link from a social post. Wherever they came from, each snippet of data can help you to analyse which marketing activities you’re doing well and where to focus your strategy going forward.
Not familiar with Google Analytics? To begin with, you might want to check out our blog ‘Measure Website Success With These Google Analytics Metrics’ to get comfortable with the platform and understand which metrics you can actually track.
Now, are you ready to dive into your Acquisition report? We’ll walk you through each section so that you can decipher what type of information is available, and what will benefit your business, with a click of your mouse.
Overview
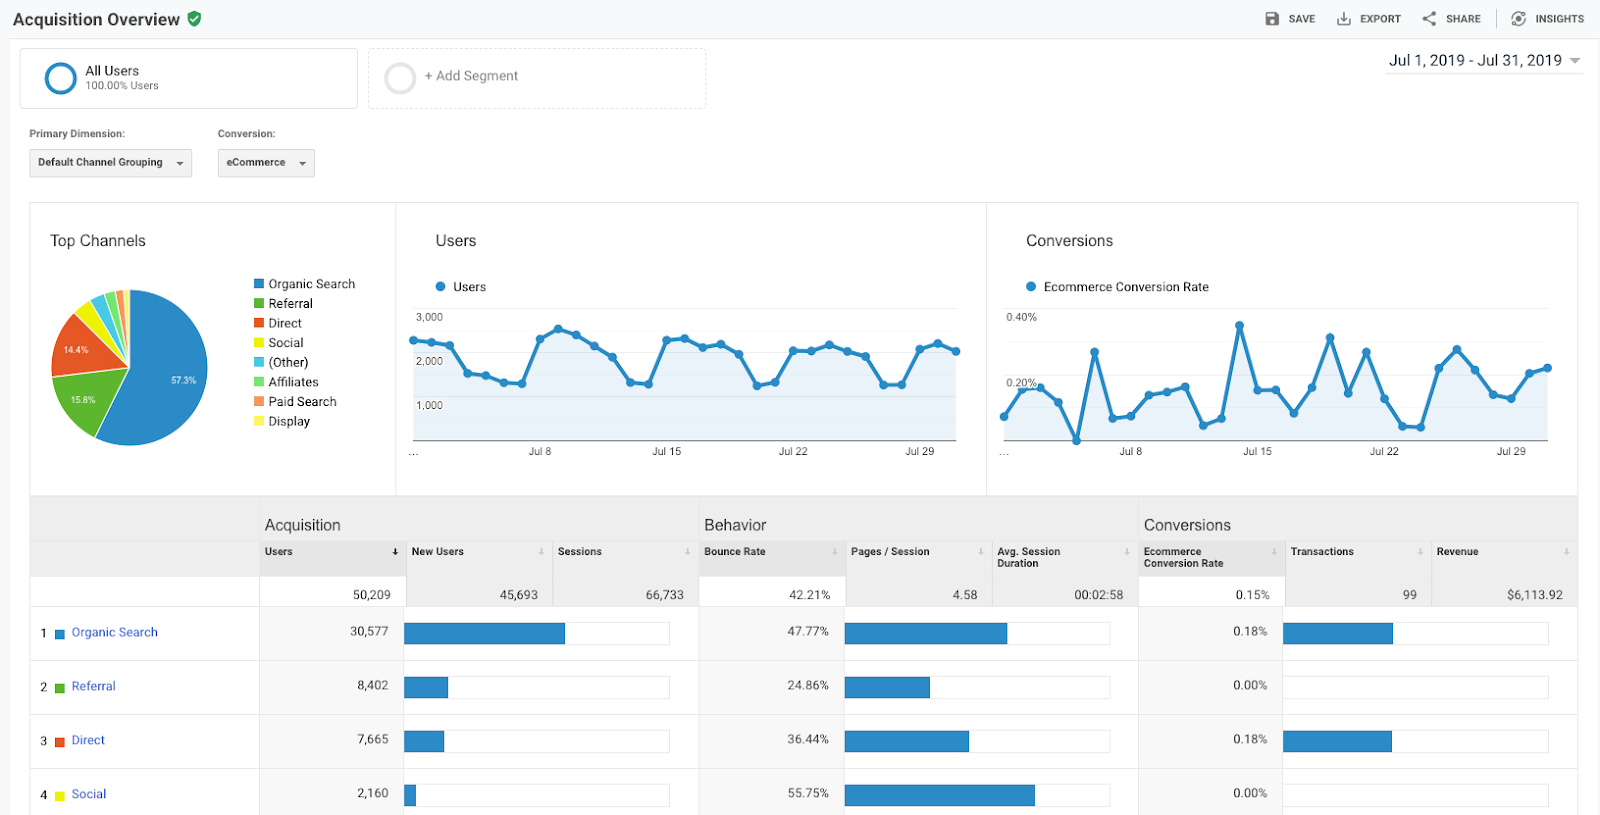
Your Overview is essentially a basic summary of everything included in each tab of the report. If you don’t have enough time to dig into your data, you can begin by browsing your top channels, behaviour from these channels (bounce rate, pages per session, average session duration) and conversions (if you have Goals set up, you can see how many people completed this Goal from each channel).
The main channels you’ll come across are:
- Organic - Traffic from search engines like Google, Yahoo and Bing.
- Referral - Traffic from another website besides search engines.
- Direct - Traffic from users typing your domain into the browser.
- Social - Traffic from social media platforms like Facebook, Twitter, LinkedIn or Instagram.
All Traffic

The All Traffic tab is split into four sections; Channels, Treemaps, Source/Medium and Referrals.
- Channels - It’s similar to ‘Overview’ but has much more detail such as you can click into each channel grouping and view top landing pages.
- Treemaps - This is a visual representation of the distribution of your channels, helpful for visually inclined readers.
- Source/Medium - In this section, you can find out the actual source of traffic. Instead of the ambiguity of ‘Social’, you would be able to see specifics like ‘Facebook/Social’.
- Referrals - You can find out which sites have been linking to your site and how many users have come from referrals.
Google Ads
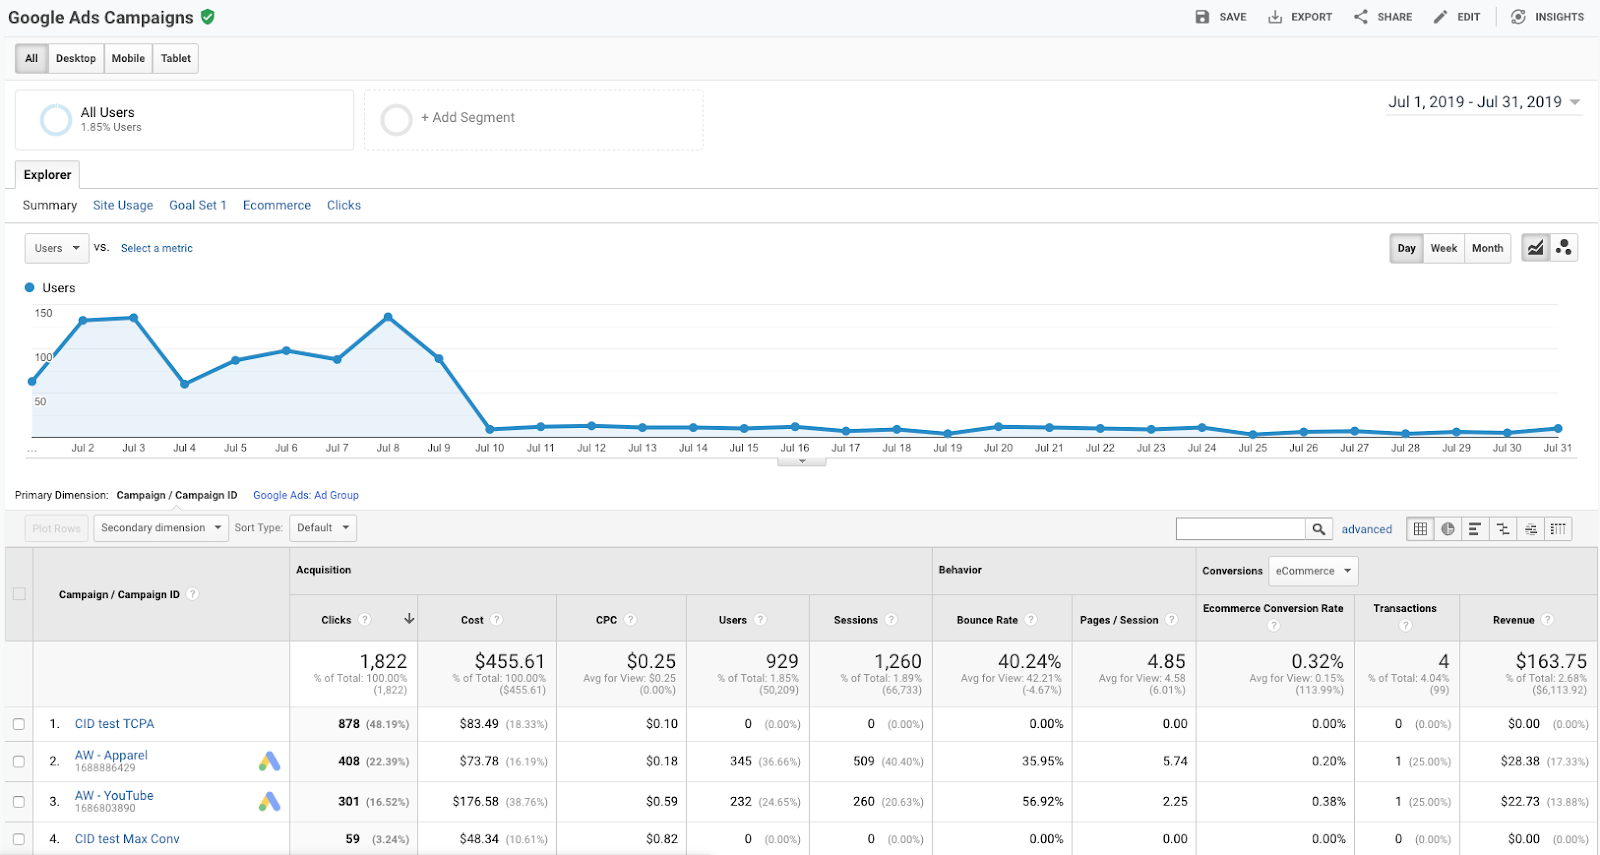
Are you running PPC campaigns? If yes, then you should link your Google Ads account to your Google Analytics! By syncing the two together, you will be able to analyse customer activity on your website after someone clicks on your ad.
For example, you might have a low average session duration for Display ads but visitors who click through from a Search ad might spend a long time on the website. This could bring up a lot of questions… Is the landing page relevant for your Display ad? Is the audience defined properly? What about placements? You can then use this data to tweak and improve your future campaigns and focus your efforts where you generate the most profit.
Search Console
As with Google Ads, you need to link Search Console to your Google Analytics, This will give you access to tons of information regarding your performance in search engine results.
You will be able to compare pre-click data from Search Console to the post-click data you already have within Google Analytics. By analysing search queries that your audience is making to find your website, alongside impressions, CTR and average position in SERPs, you can work out if your website is optimised for search engines. If you’re ranking poorly, you might look to practice long-term SEO techniques.
Social
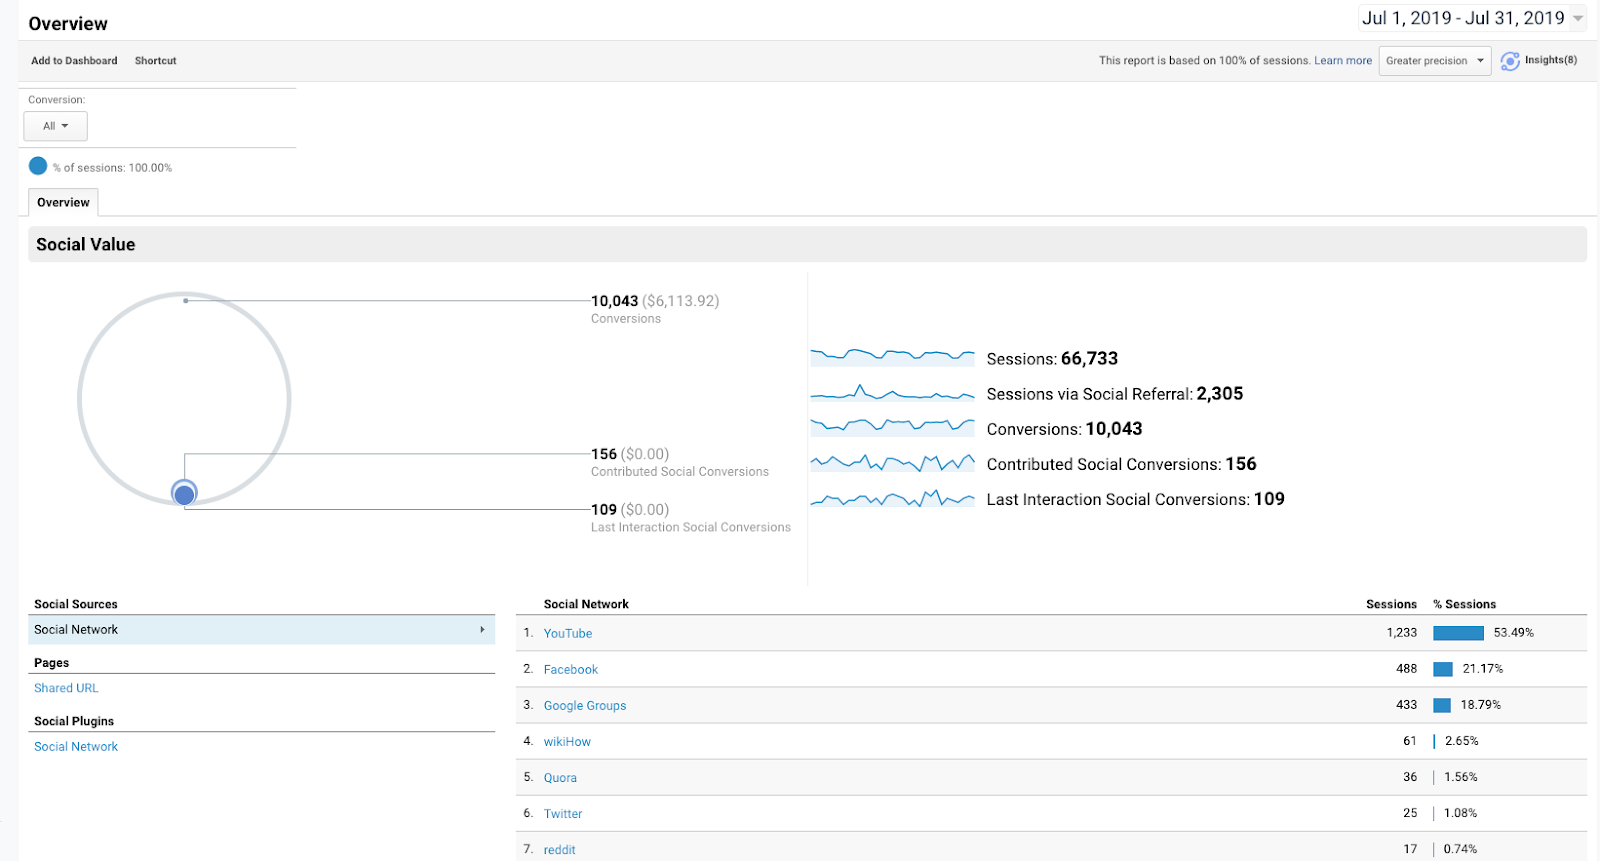
The Social tab will allow you to weigh up how successful each social media channel is in driving traffic, engaging your customers and encouraging them to convert. Unlike your social media analytics, you will be able to see the missing piece of the puzzle; does social media marketing generate revenue for your business?
You can also look at the user flow to analyse landing pages and see how many interactions a user will have on your website before they leave. Imagine you have an e-commerce business and visitors are coming from social and then leaving during the checkout process. Do you need to run a remarketing campaign using Facebook Pixel to get them to complete their purchase?
Campaigns
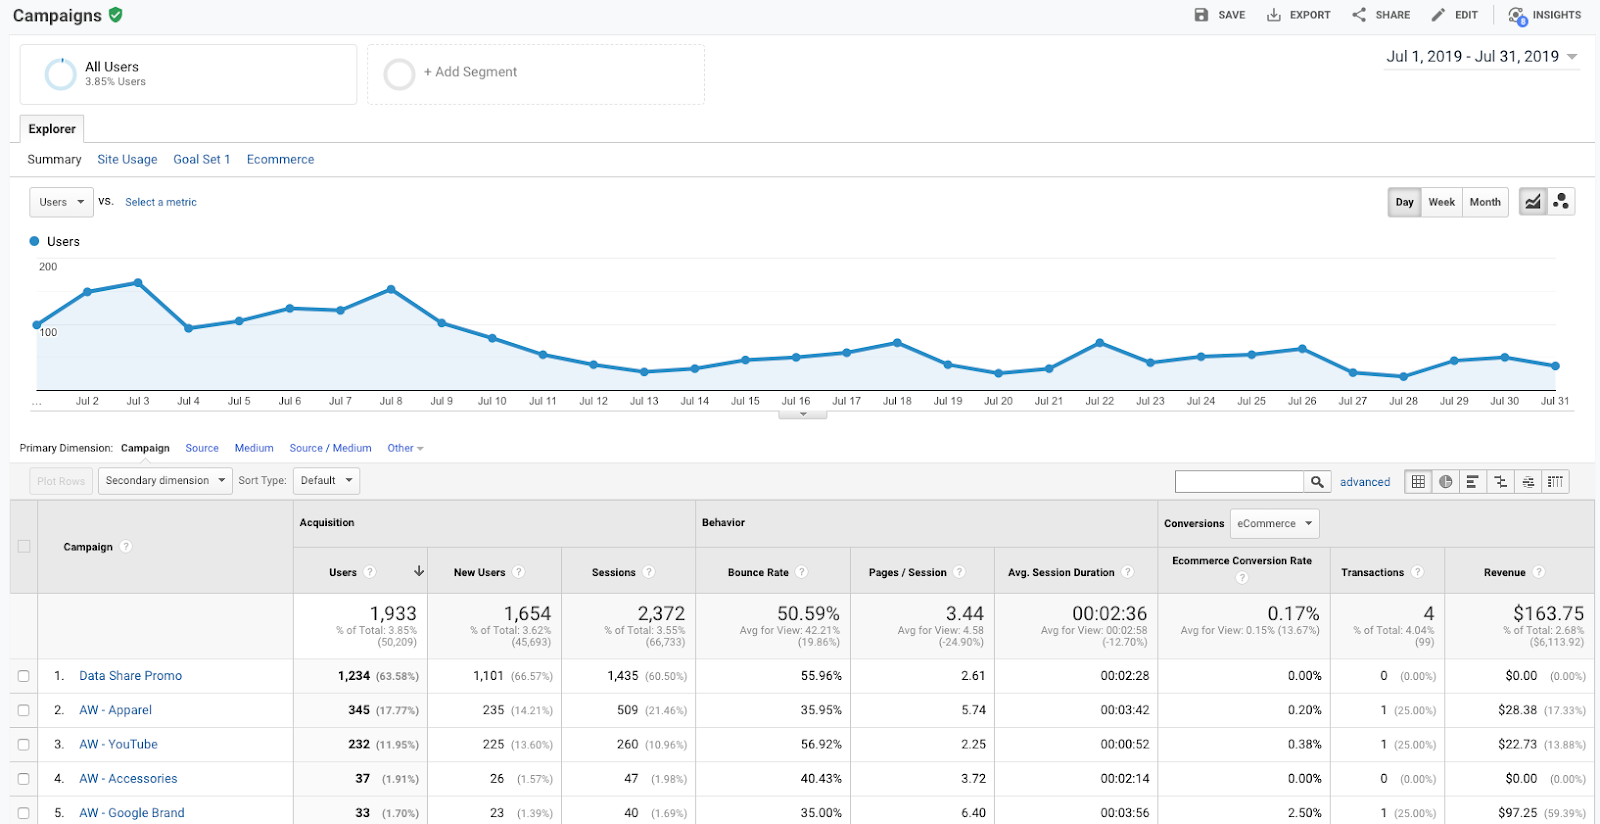
If you use UTM parameters to define your marketing activities, you can check out Campaigns from a number of channels at the same time.
Not sure what a UTM parameter is? Ever seen a URL like ‘test.com/utm_source=social&utm_medium=facebook&utm_campaign=summersale’? This technique is handy if you want to differentiate Google Ads, email newsletters and even specific social media marketing campaigns to see which is most successful.
You can even set up your own UTM parameters quickly and easily using Google Analytics Campaign URL Builder!
Whew! Acquisition data can be a lot to take in but it sure is handy, especially for marketers, to see what marketing activity is driving traffic to your website and what actually results in conversions. Make sure to keep track of this data on a regular basis in order to evaluate your marketing strategy and grow your business!